
Annual Breach Report
The information contained in this report is a summary of the data collected by a variety of sources regarding data breaches. By studying the breach reports submitted to various government agencies we can draw conclusions surrounding breaches over the past year, including: the type of breaches being used by hacking groups, the attack vectors being used, and the types of businesses being targeted. These conclusions allow us to provide insight to organizations to create defensive strategies to address and plan for attacks.
This report is being published at a different time of the year past reports. Publishing the report later in the year allows review of not only the cyber breaches reported to the states of Nebraska and Iowa, but also a review of some of the other information gathered from additional attorneys general websites.
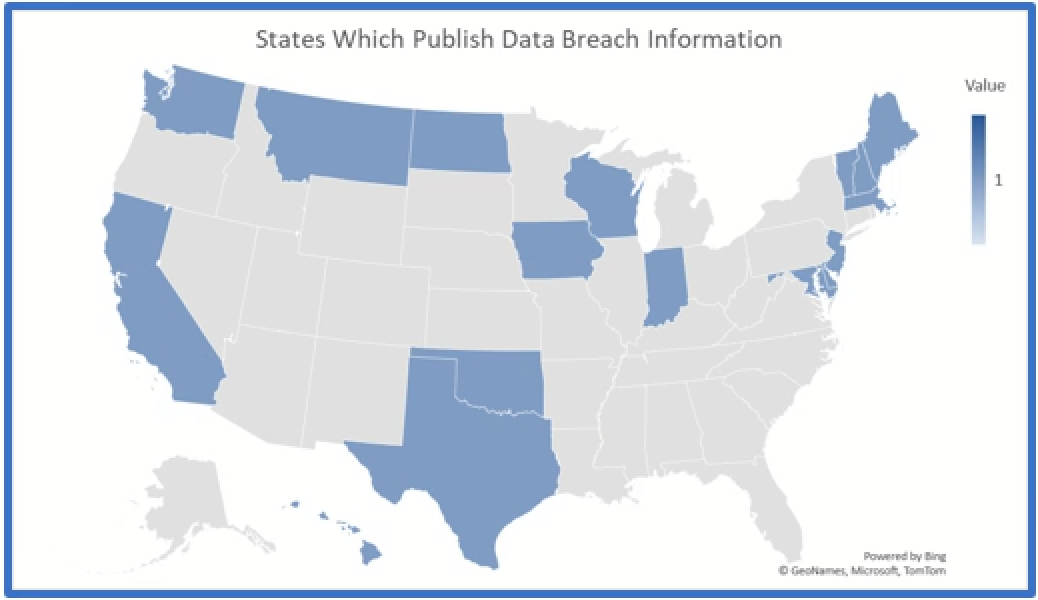
There are eighteen states which publish breach information and there are other state that do not publish data breach information but will provide the information upon request. Nebraska is one of those states that will provide information upon request.
In addition to state breach notification information, some federal websites publish breach information. The most well-known of the federal sites is the Office of Civil Rights (“OCR”) website. OCR publishes the number of breaches reported to it, as well as the types of attacks and the location of the information compromised.
In the past this annual report only included information obtained from the Nebraska Attorney General, but this year’s report will include information from other states and the OCR website. The information is presented separately, however, for a variety of reasons. The reasons for the separate treatment are that each of the authorities may have different thresholds for reporting the data breaches; the organization may have a different definition of what constitutes a data breach; and the organization may collect different information on their data breach forms. These differences would make combining all of the disparate breach information to be confusing and misleading.
Nebraska Breaches – Breaches Reported to the Nebraska Attorney General
As noted, the Nebraska Attorney General not publish data breach information, but the information can be requested. The information was provided as a complete copy of all of the data breach information and has been requested at the end of each year. Every effort has been made to compare the information with information provided in prior years to remove any duplicates and update information provided previously but updated in a subsequent year.
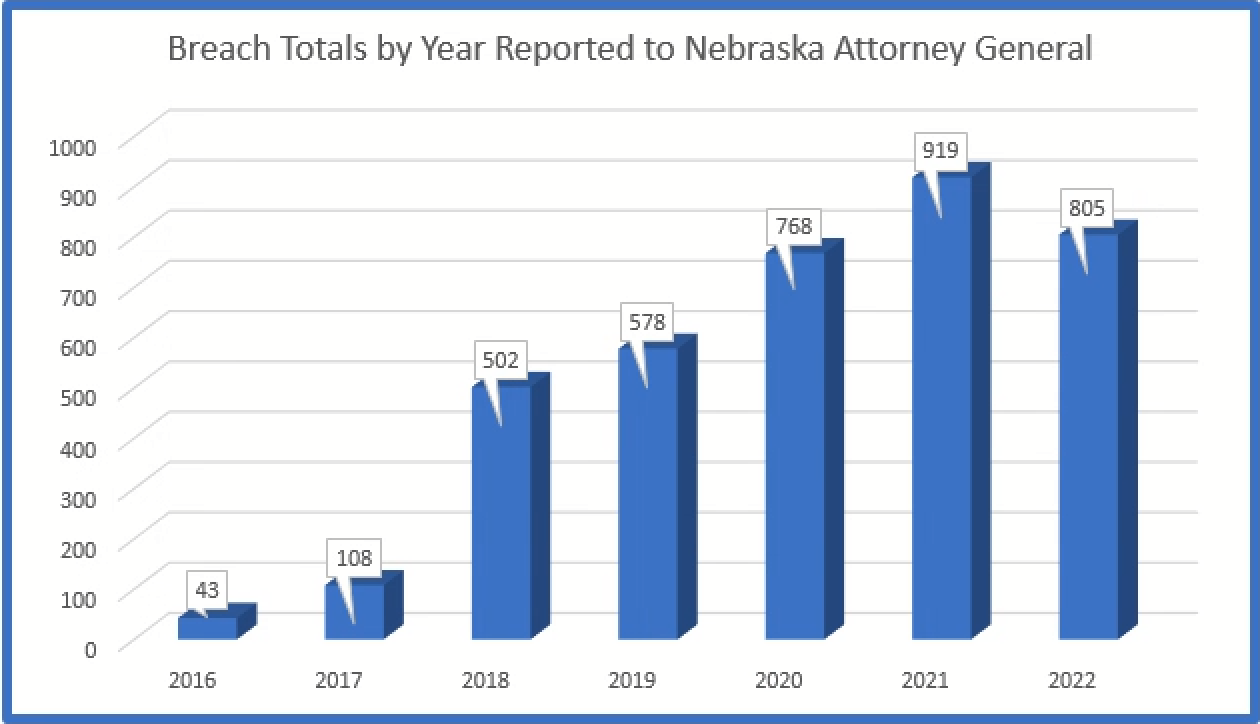
The Nebraska Data Breach Set (“NDBS”) is representative of the trends across the other data sets. This means that the NDBS show a long-term upward trend resulting in a continued increase in reported breaches. Most data breach sets showed a slight decrease in the number of breaches reported in 2022. The reasons for the decrease have varied. Some have speculated that that the Ukrainian war has resulted in hacker and attackers fighting each other, but no data suggests that the long-term trend of increased attacks is slowing anytime soon.
Nebraska is one of the few states which requires notification to the Attorney General if there is even just one Nebraskan’s information compromised in an attack. Because of this requirement we can garner more information from the information provided by the Nebraska data breach information than other states which have a threshold for reporting such information. The difference is obvious when comparing the information provided to another state, for example, Iowa to Nebraska.
The following chart illustrates the difference between Iowa and Nebraska – two Midwestern states which share a common border with not too dissimilar population sizes, and that share very similar definitions of personally identifiable information (“PII”), all of which should (in theory) result in similar data breach reporting numbers.
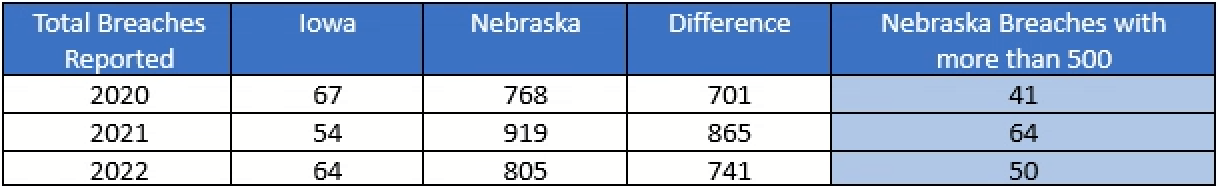
The differences can be explained by looking at Iowa’s reporting threshold. Iowa has a reporting threshold of 500[1], meaning there must be at least 500 Iowa residents affected by the breach before the organization is required to notify the Iowa Attorney General’s office. Indeed, filtering the Nebraska data breach information for breaches where there are greater than 500 Nebraska residents (see the last column in the figure above), the data breach numbers for Nebraska would have dropped to 41, 64, and 50 for 2020, 2021, and 2022, respectively, which is much more comparable to Iowa’s reported breaches.
If the differences between the Nebraska and Iowa numbers are explained by the number of smaller breaches being reported to Nebraska, then studying the information provided to the Nebraska Attorney General is much more useful and meaningful for a smaller business. The types of breaches affecting smaller businesses can only be reviewed, digested, understood, and used to teach the lessoned learned if we look at data breach sets, such as those provided by Nebraska. The information provided is not broken down into small and large businesses because, as shown in the table below, the vast majority of breaches in the NDBS are from smaller breaches.
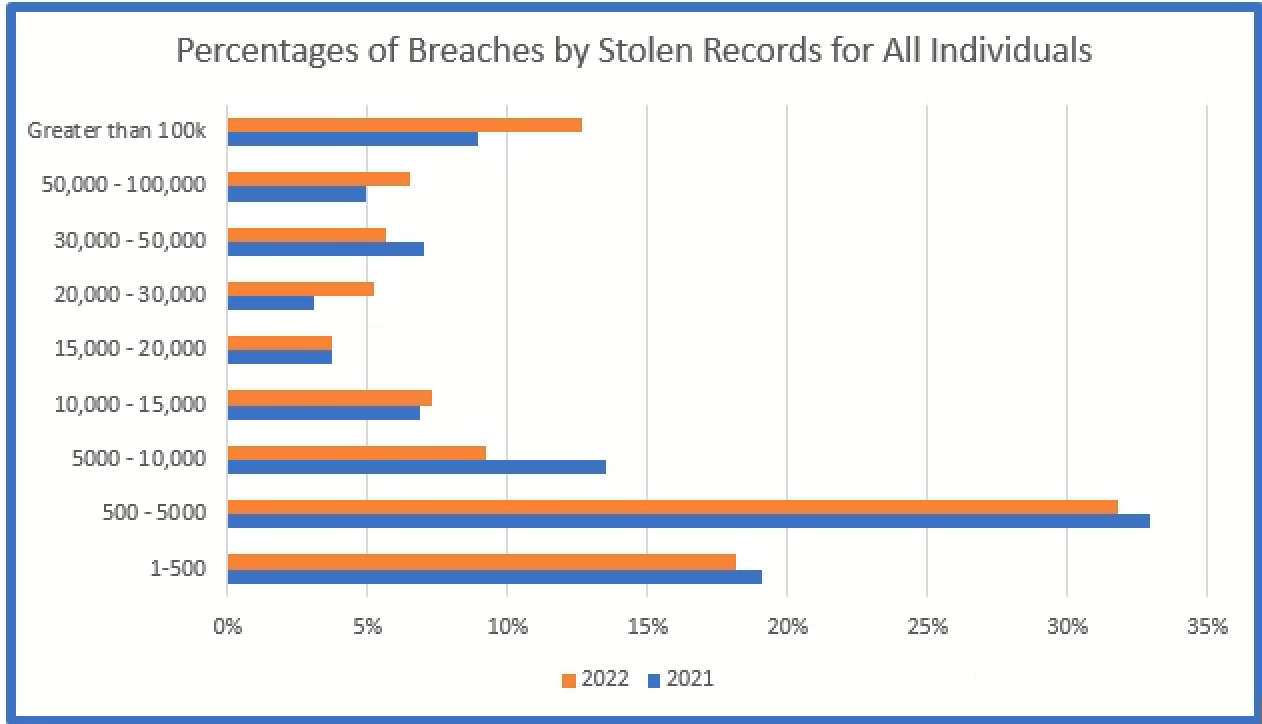
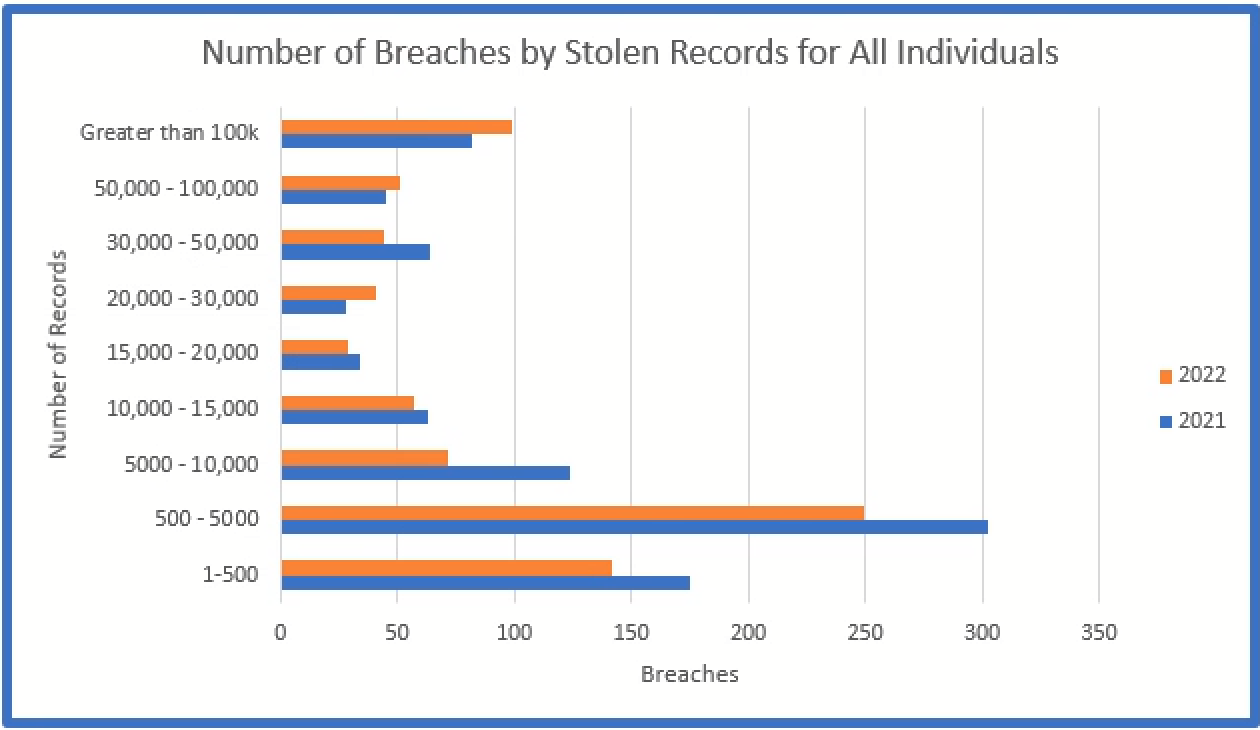
The below graphs depict the total number of breaches by the number of records stolen for all individuals (Nebraskans and others) and the percentage for each of those groups. The majority of the breaches involve less than 5,000 affected individuals.
An analysis of breach information without consideration of the smaller breaches would exclude a significant amount of relevant information. All too often, media concentrates on the larger breaches without consideration of the vast majority of data breaches reported and how the attackers were able to penetrate the networks of their victims.
Smaller companies are more susceptible to hacking due to a number of factors, but the most important factor being the lack of information technology staff, software, and resources. Attackers know this and target smaller companies because the companies are easier targets and because smaller companies can often lead to information that allows hackers to then target larger companies.
Summary of Information from the Nebraska Data Breach
The information presented below is in the form of tables with a brief description of the data represented. Simple graphs and/or charts are used to present information quickly and easily. The complexity of the NDBS can be better understood when presented by a graph rather than a narrative or table because the graph can reveal a trend or comparison in concise easily digestible format.
The Data Breach Charts
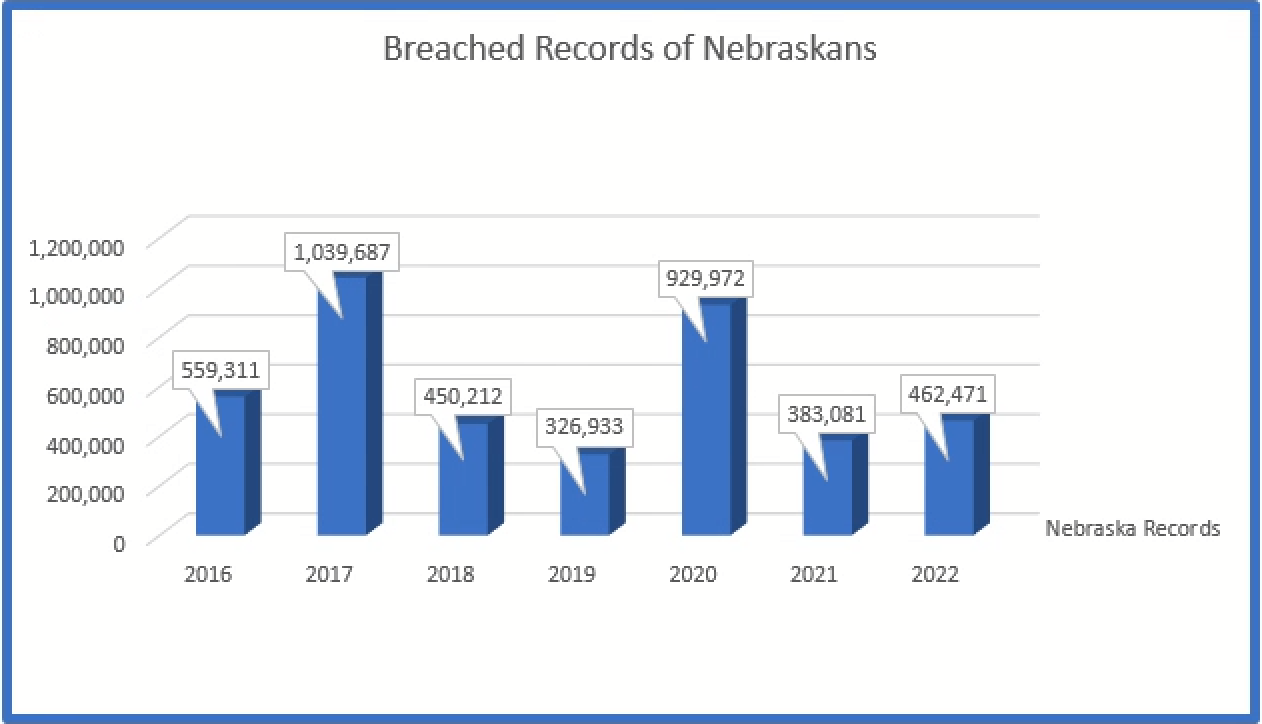
The total number of records related to Nebraskans is over 4 million records since report of such information became mandatory. Nebraska has only approximately 1.96 million residents; which means every resident’s data has on average been breached twice!
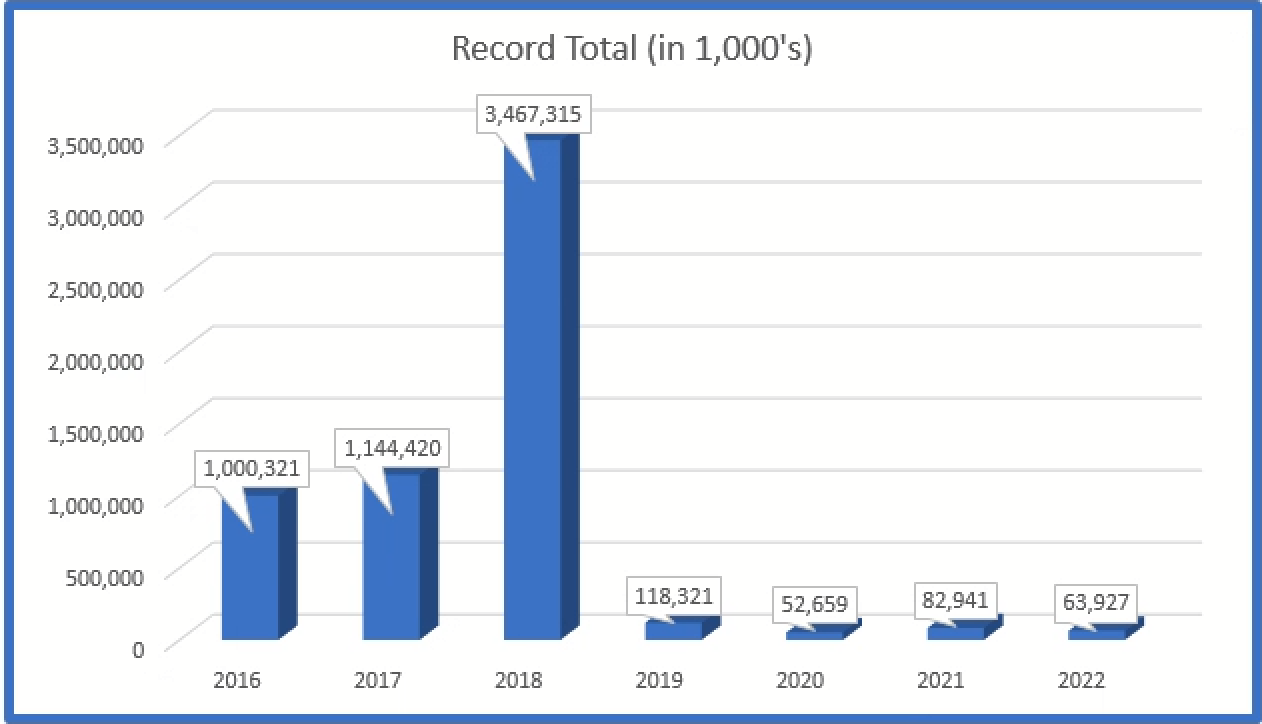
Total average number of affected individuals in all reported breaches has decreased over the years although the number of breaches has continued to increase.
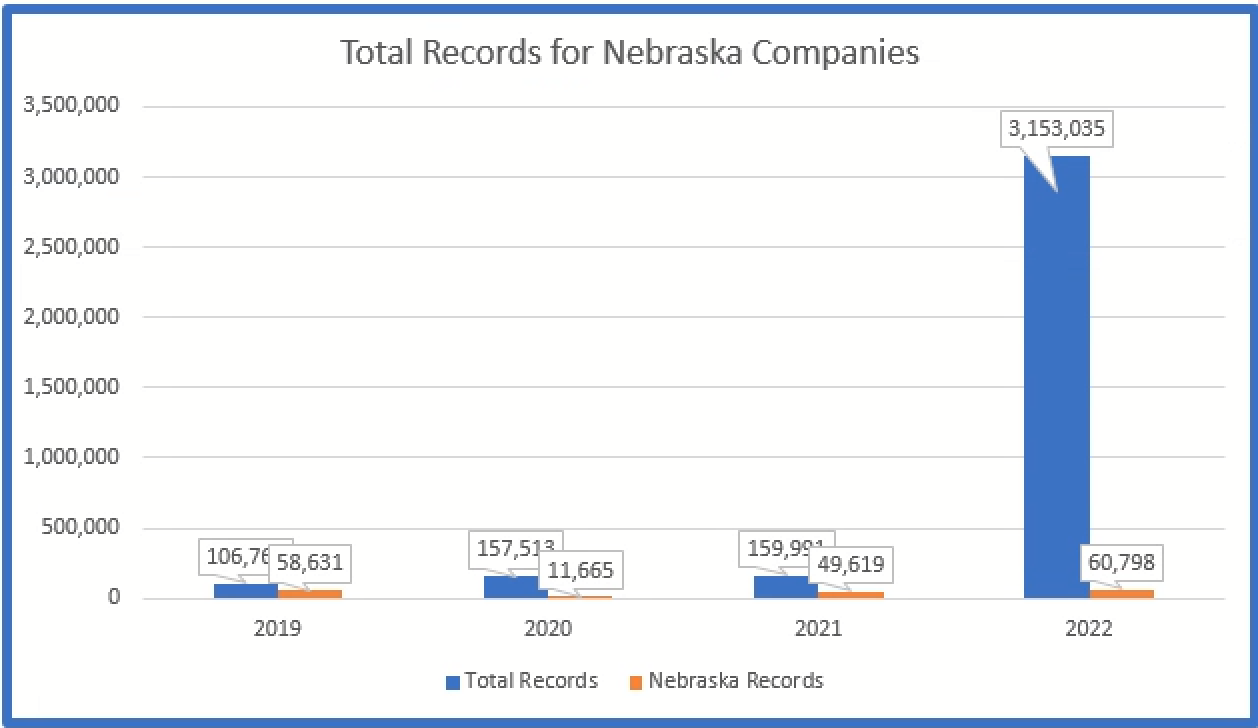
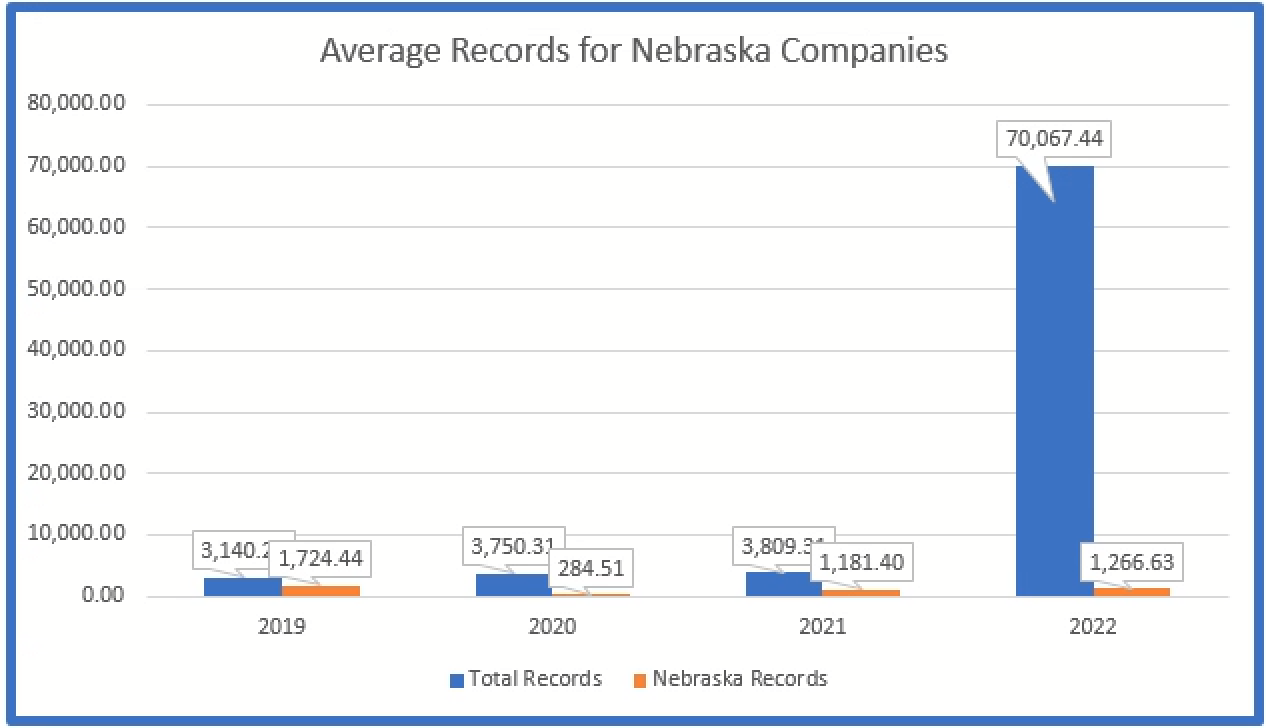
The below graph depicts the average number of records in breaches reported by Nebraska based companies. The average increased considerably in 2022 because of two large breaches from Nebraska based companies.
General businesses, financial institutions, and healthcare organizations account for almost 75% of all breaches.
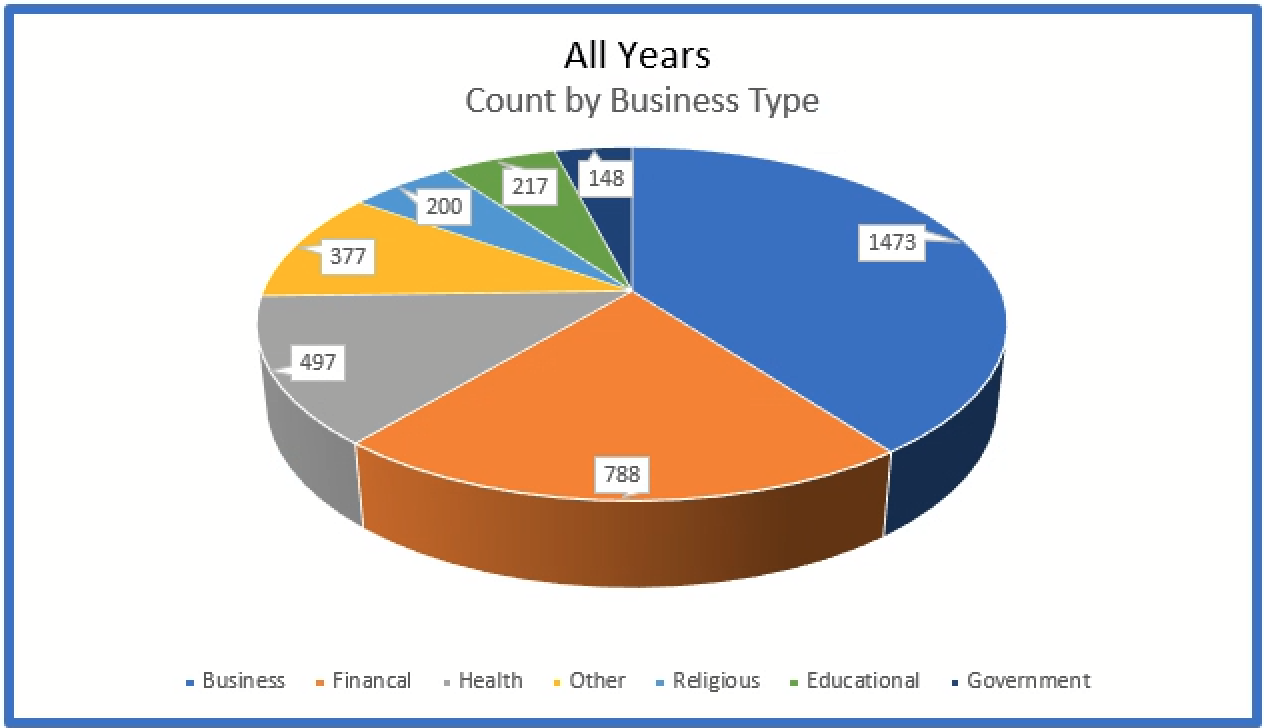
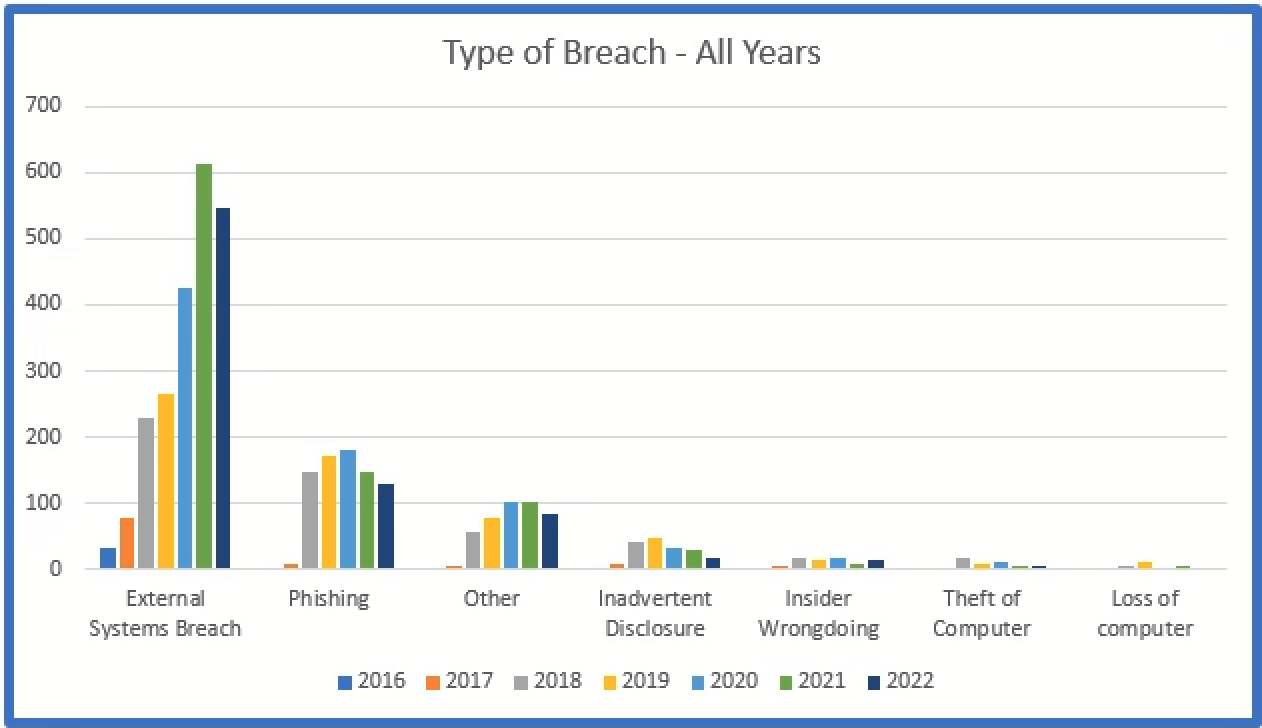
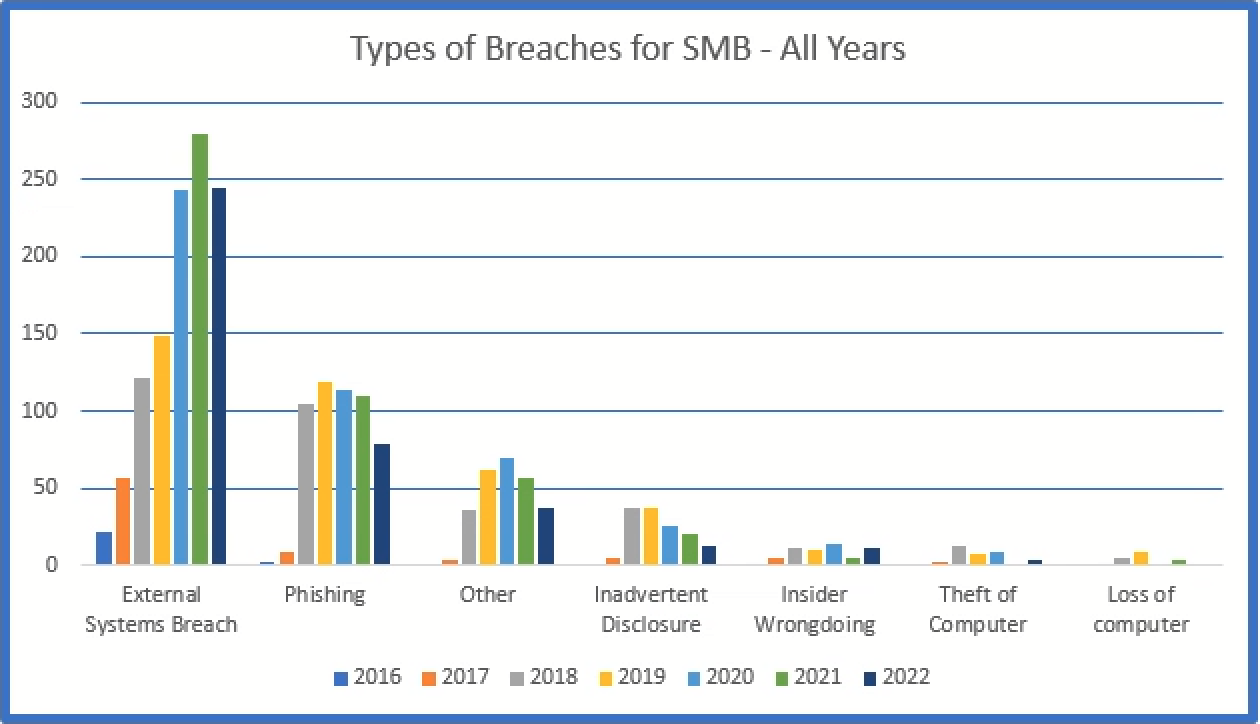
The below represents the types breaches for all sizes of organizations, while the second graph depicts breaches involving less than 5,000 affected individuals.
Healthcare – Breaches Reported to OCR
The Office of Civil Rights (“OCR”) publishes all breaches that impact over 500 individuals. This list is published on the OCR website and a summary of the information is in graph format below.
The number of breaches reported to OCR since 2010:
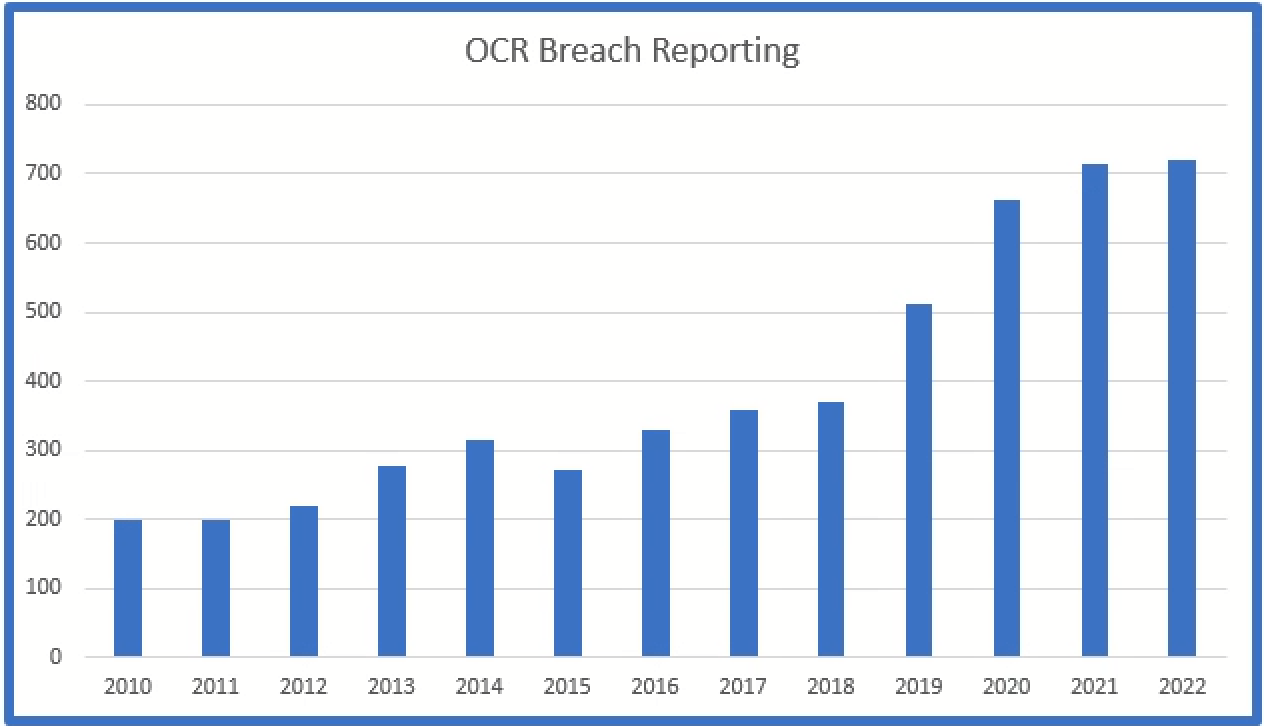
The number of breaches reported has continued to increase every year although the year over year increase has slowed in recent years.
The types of breaches reported to OCR since 2010:
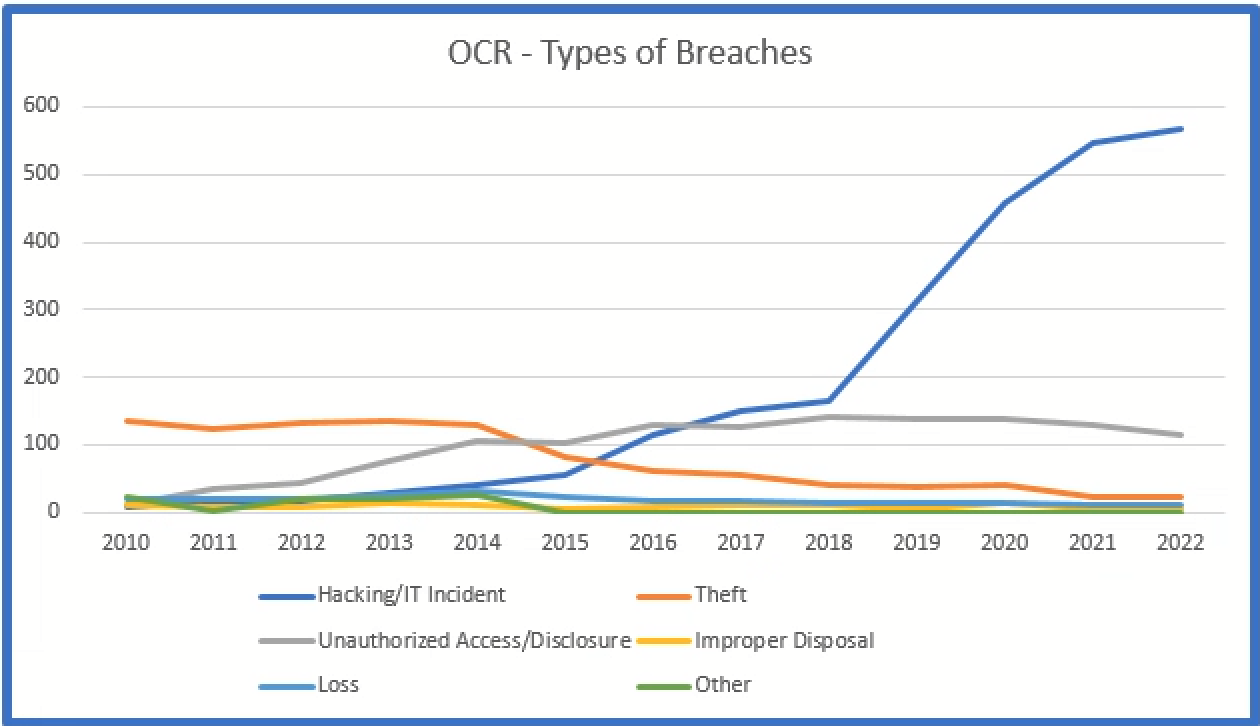
Theft of devices was initially the most common type of incident, but since 2017 external hacking has become the most common. External hacking now out numbers all other incidents combined.
The location of the hacking incident since 2010:
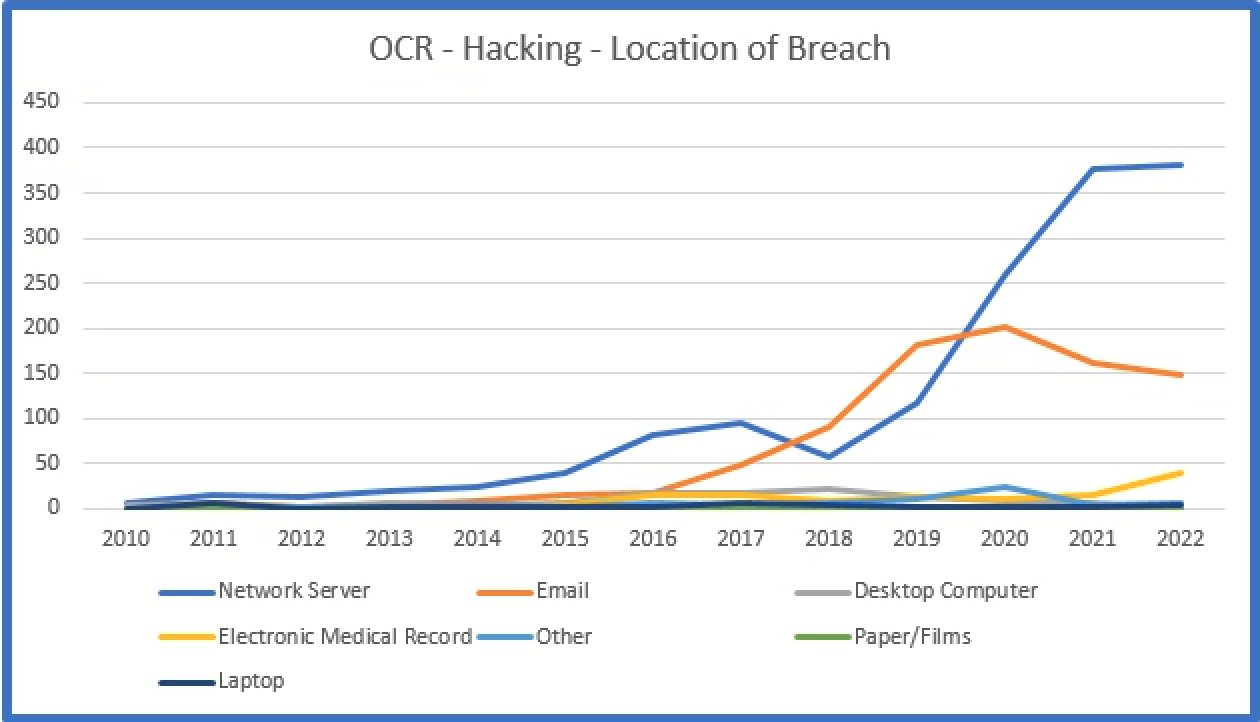
The most common location of an external breach are network servers since 2020. Email continues to be the second most common location of a hacking incident.
Attacks through Vulnerabilities
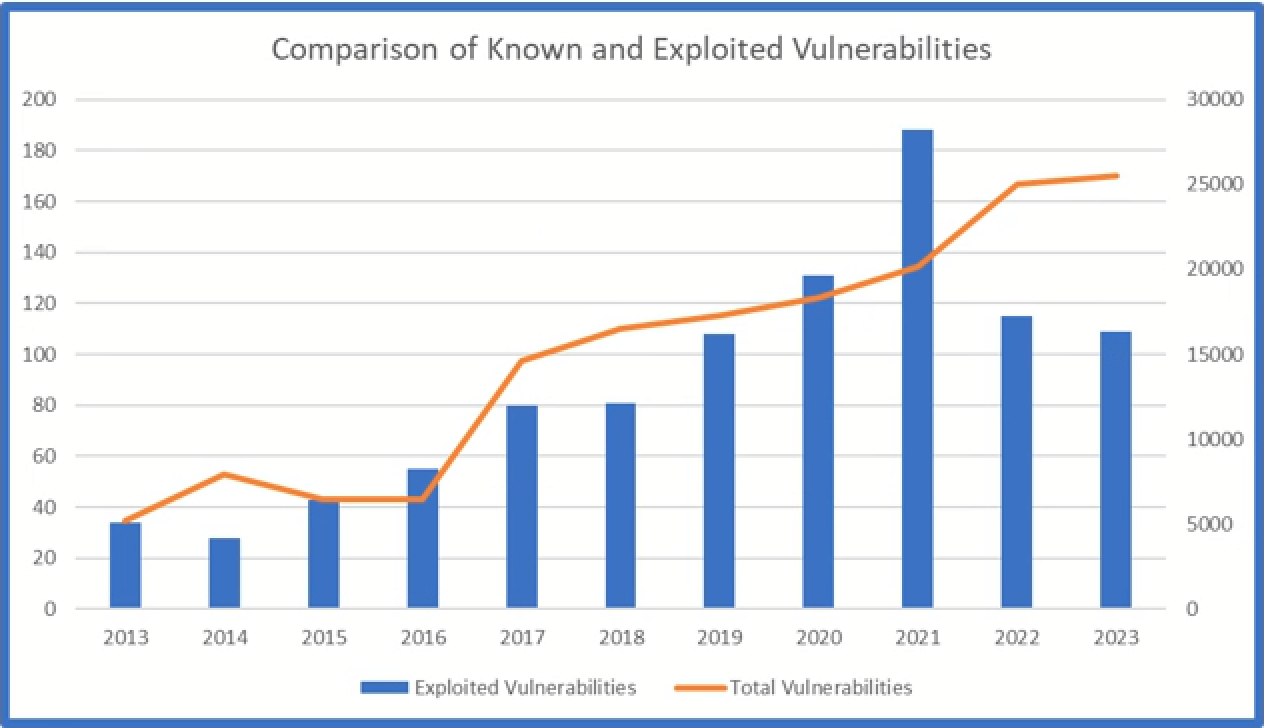
Indeed, the number of Common Vulnerabilities and Exposures (“CVE”) tracked by the National Institute for Standards and Technology (“NIST”) continues to increase each year.[2]
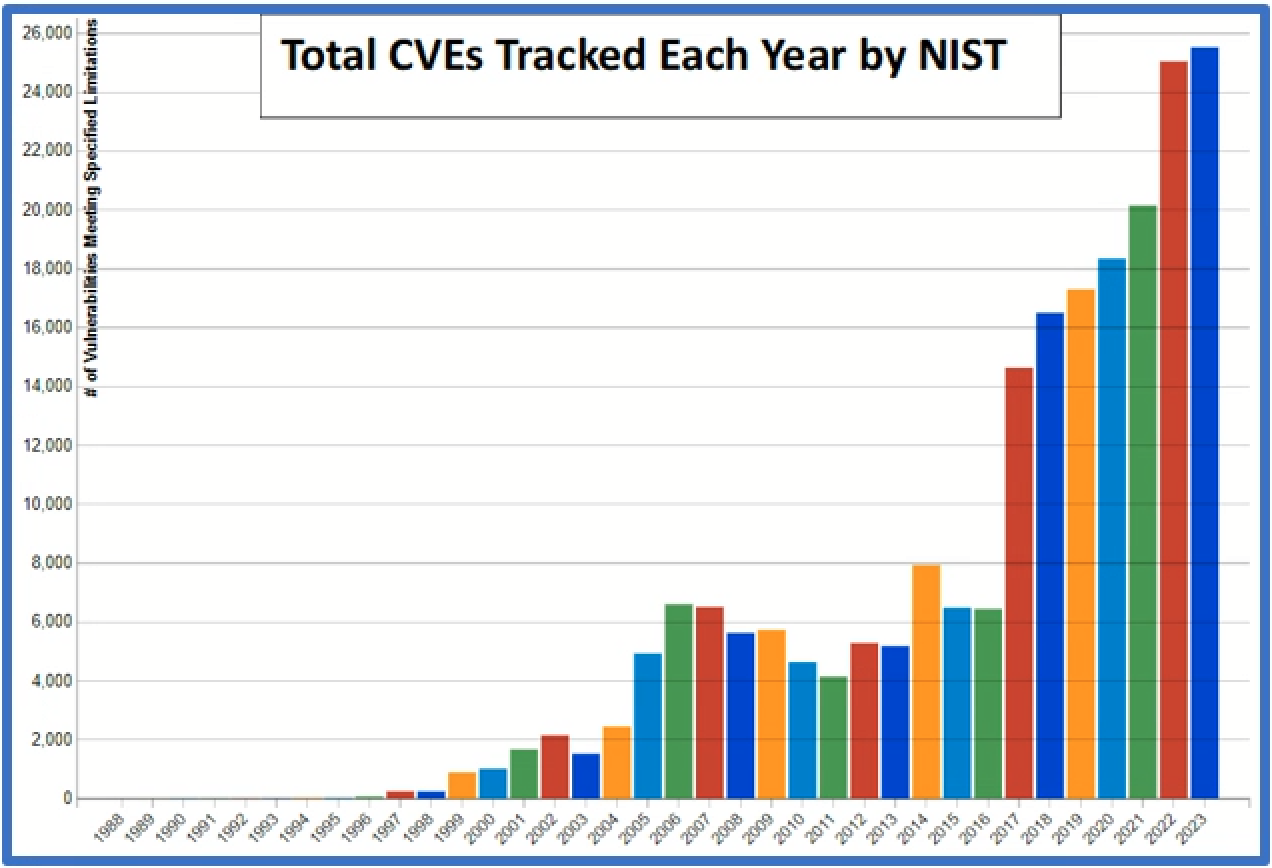
The total number of CVEs each year is a good indicator of breaches as hackers are often monitoring the same channels as security personnel to find and exploit security flaws. Security flaws are often easy to exploit because developers and bounty hunters regularly provide a proof-of-concept (“POC”) of the flaw in the form of code or scripts. There are numerous examples of this type of activity. Hackers have become very adept at monitoring and using POCs and have even started posting fake POCs with embedded malware in an attempt at further exploitation.
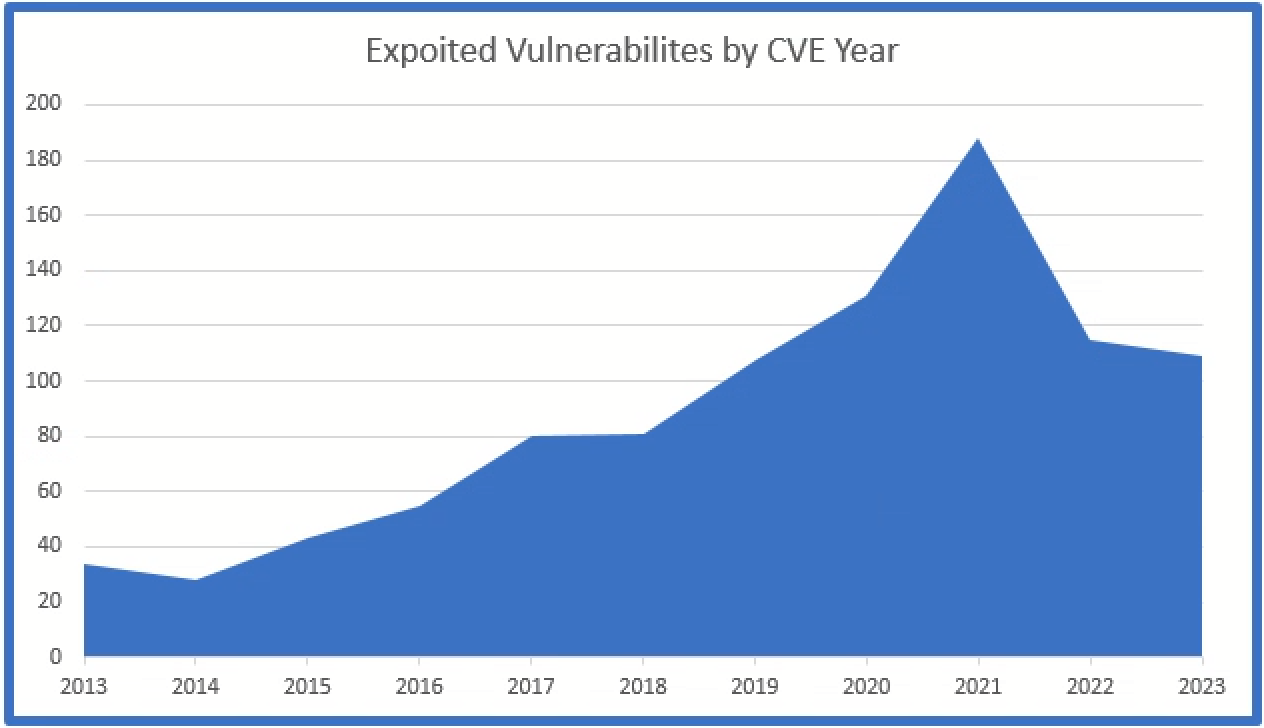
Recently NIST began to track whether these vulnerabilities had been exploited in the wild. To track this information NIST established the “Known Exploited Vulnerability Catalog” (“KEV”).[3] This catalog tracks the particular vulnerabilities exploited by hackers on a system. The catalog also tracks the particular vulnerabilities used in a ransomware attack.
The list shows that vulnerabilities are not just theoretical issues, but actual threats to the confidentiality, integrity, and availability of sensitive data.
When we overlay these charts with the Known Vulnerabilities and the Exploited Vulnerabilities, we can see the positive correlation between the two as a close relationship between the two statistics:
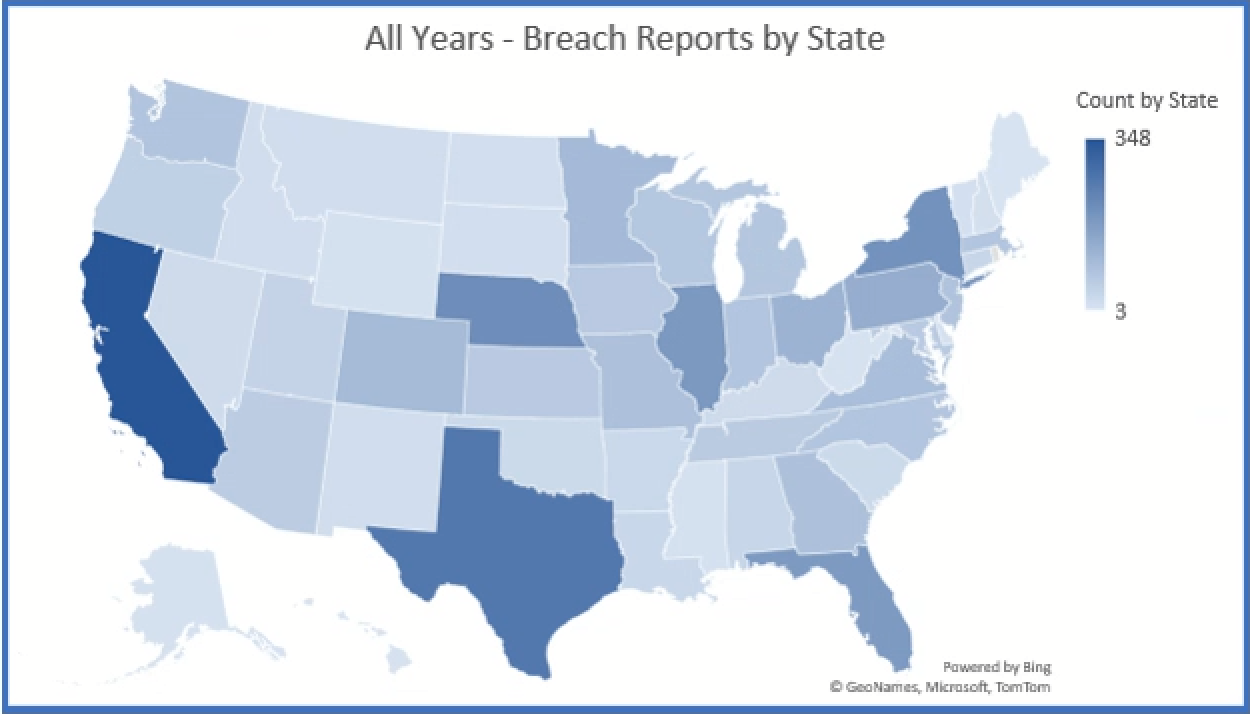
Review of Data Breaches Reported Around the Country
There are seventeen attorneys’ general sites which openly publish breach notifications. The states which do publish data are:
|
 |
Of those states which publish data, the six underlined states above are included below in charts for comparison. Interestingly, Indiana requires every breach to be reported, regardless of the number of affected individuals, to the Indiana Attorney General and there were almost 1,300 breaches reported.
Each state, with the exception of Iowa, reported a small dip in the number of breaches reported in 2022.
California
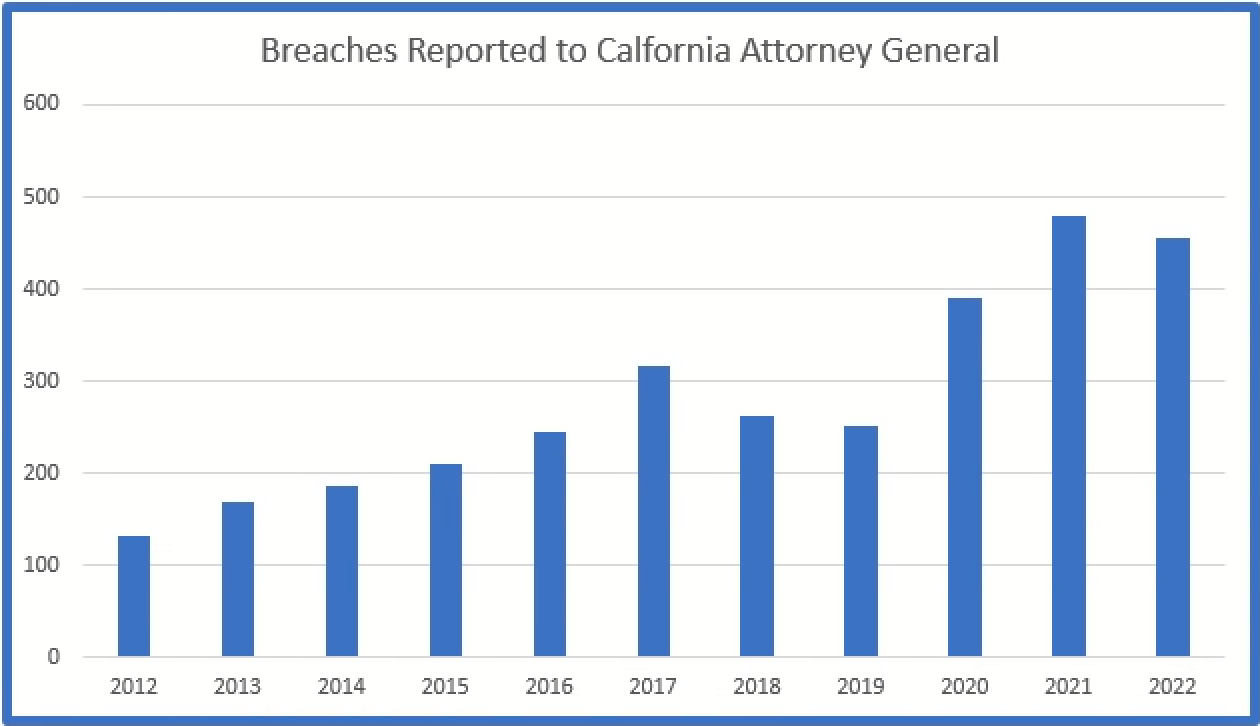
California requires breaches which affect over 500 residents to be reported.
Indiana
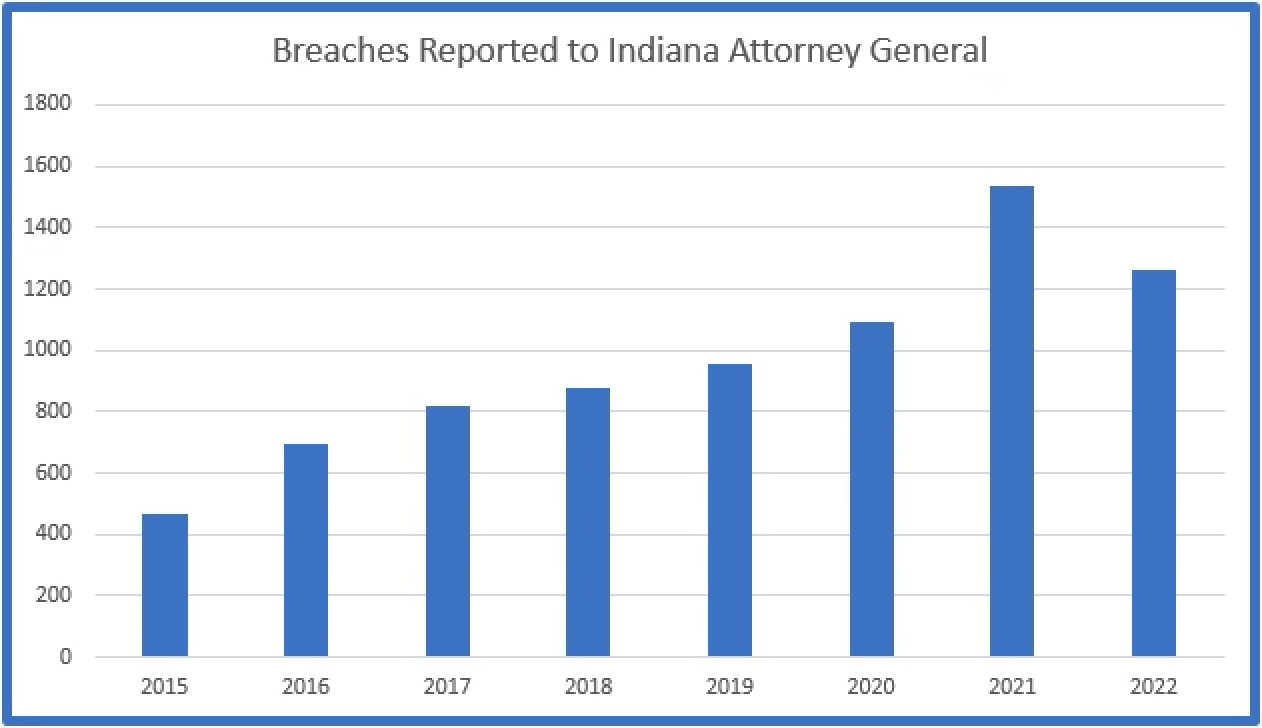
Indiana requires every breach, regardless of the number of affected residents, to be reported.
Iowa
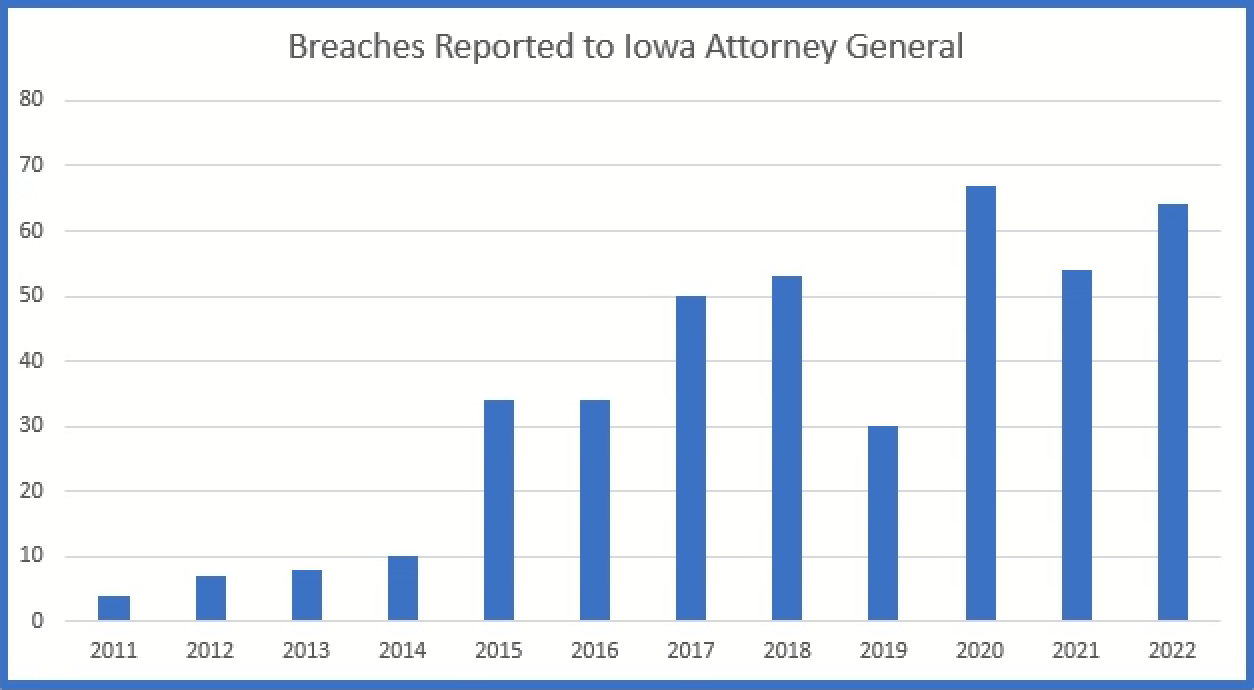
Iowa requires breaches which affect over 500 residents to be reported.
Maine
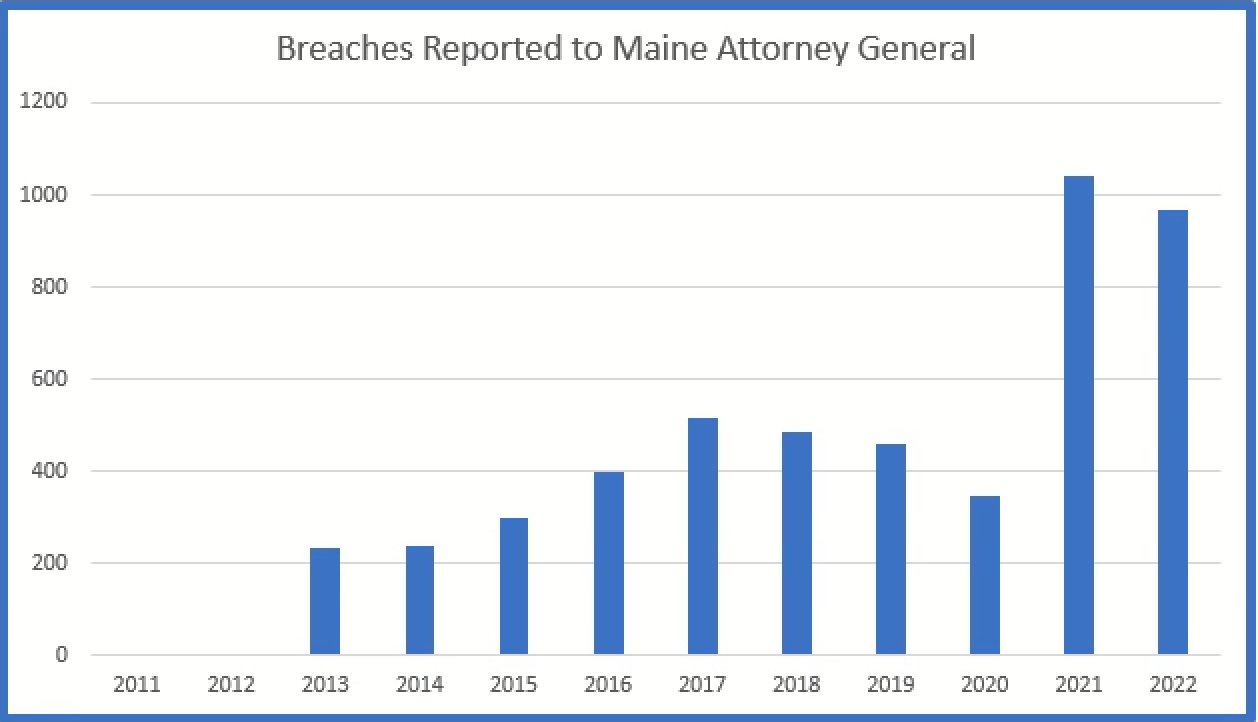
Maine requires notice of all breaches to be reported.
Oregon
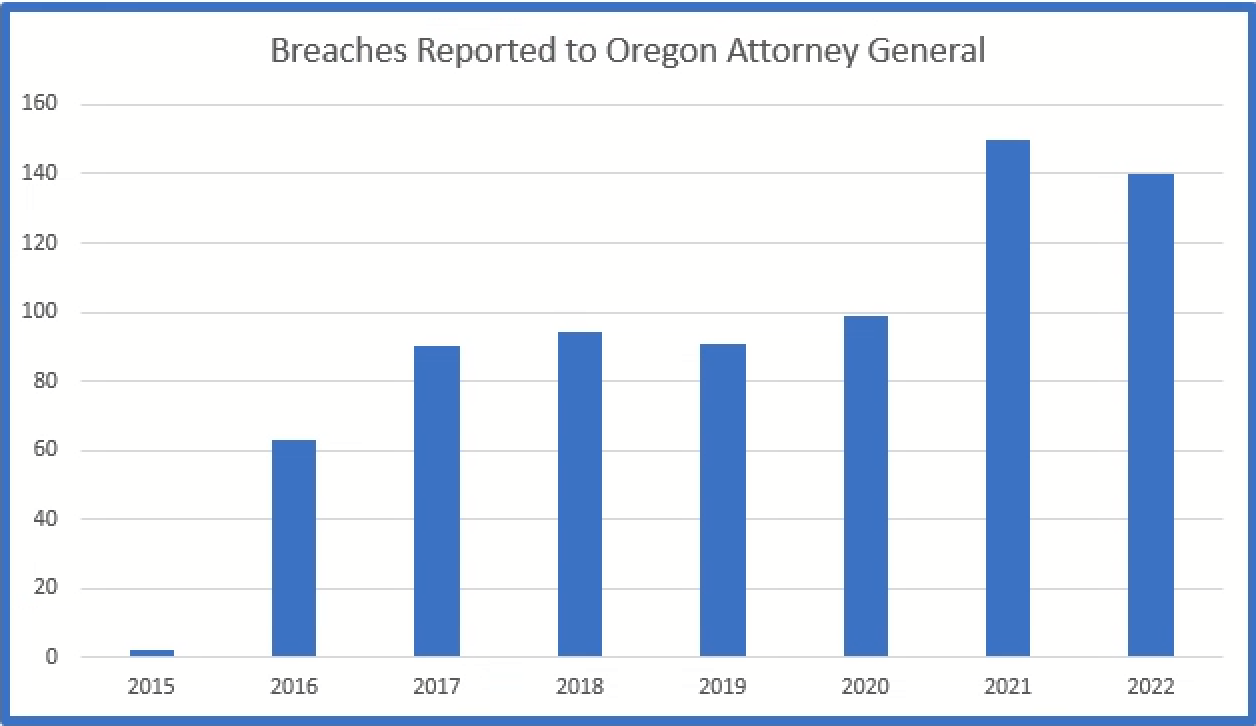
Oregon requires breaches that affect over 250 residents to be reported.
Washington
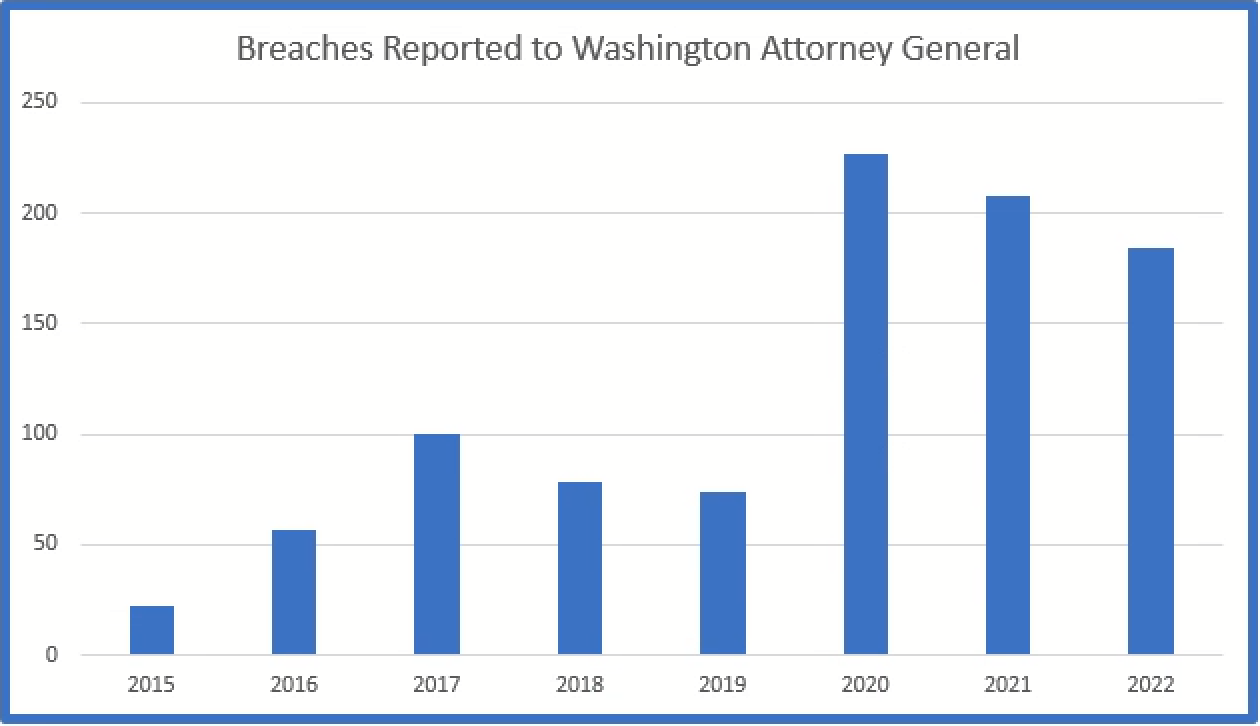
Washington requires breaches which affect over 500 residents to be reported to the Attorney General.